Our moderator @Luke from JasonBondPicks chat room has shown
us on last week’s webinar on how to play the gap and how to actually ‘make a
living’ just by playing ‘gap strategy’ alone. I think that was a great webinar
which he showed all his strategy step by step on how to draw trend line to
determine buy and sell signal, also on what to look for on RSI and MACD when
playing the gap. If you like to see the video and learn this powerful strategy,
sign in at JasonBondPicks and it will be in Webinar#7 under BondSwingTrades
menu.
Enough said with the gap strategy. What’s a gap? a gap is
a break between prices on a chart/graph, that’s it! Gap can be form during
trading hour OR between trading hour, but the most common gap that we see
everyday is ‘between trading hour’.
So what’s ‘between trading hour gap’ how can I spot it?
It is a difference between prices from a previous’ day close
and the next day’s open, giving that open market is at 9.30am and close at 4pm
EST. Here is a gap up example (from the chart), you can see that $AAPL close at
around $562 yesterday and open today around $570, so that’s a $8 gap up.
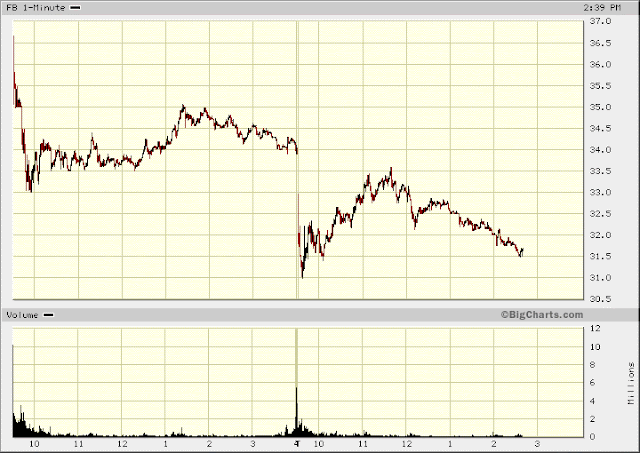
Here is a gap down example from the most hyped up company of
all. Facebook Inc. $FB. From the graph you can see that Facebook closed around
$34 yesterday and opened today at around $33, that’s a $1 gap down.
So there you have it, basic concept about the gap. BUT could
trading occur between the gap?
The answer is yes, but most of the people don’t realize that
they can trade after hours and premarket. However, it is less liquidity, wider
spread and more volatile. Most of the time, individual investors should avoid
trading after hour and premarket. Below is an example of intraday $AAPL chart
with pre market trading PS. For Etrade pro, go to chart setting and check ‘show
extended hours chart’ then apply.


