
Before you learn about chart patterns, technical indicators,
scanners and all the fancy tools on your trading platform, you need to learn the
basic of technical analysis. So today I am going to talk about support and resistance
level. But before going into that, I would like to give you an idea on why
technical analysis works. You might have heard people talking about charts like
“the chart is breaking out” or “it’s at support level and should be a good
entry here” or “it’s just crossed 50-day moving average so it will go up!” How
does this work? And why stocks do what people think they will. A simple answer to this is, it’s a self-fulfilling prophecy! The more people use technical
analysis, the more stocks will react to that. When people see something on the
chart, they react on it base on what they have learnt (about technical
analysis). All traders have learnt the same thing, thus pushing the price of a stock into particular direction.
That’s a simple explanation and that’s the reason why YOU should learn and use
technical analysis too.
Okay, so what’s the definition of support and
resistance? (Ps. my definition)
Support: Refers to a certain level where stocks could not
move lower when trading at that level, and eventually will move up and away
from that level.
Resistance: Refers to a certain level where stocks couldn’t
move higher when trading at that level, and eventually will move down and away
from that level.
A break: This refers to when support or resistance level has
been broken. For example, when trading at support level and a stock keep moving
down and pass that level (breakdown). Or when a stock approaches resistance
level then keep moving up and breaks that level (breakout).
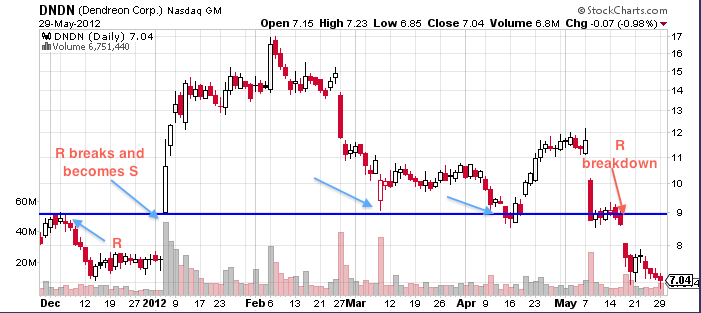
Another rule on this: once the support breakdown it
becomes resistance. And once the resistance breakout, it becomes support.
So below are some charts and example of support and
resistance. PS. S:support, R:resistance.
 |
| I meant to say S breakdown on the far right arrow |


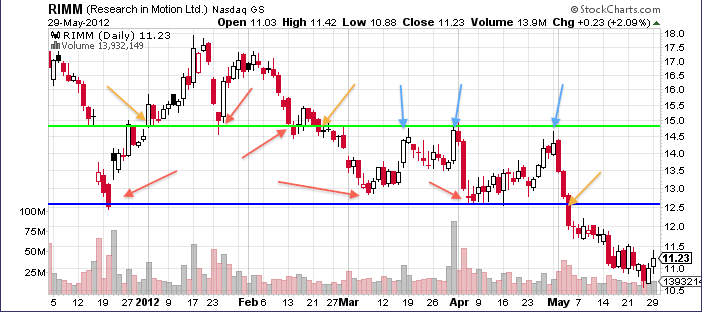
Above is Research in Motion Ltd. (RIMM) and it's a quiz for you to practice this simple concept.
Red arrows: ?
Yellow arrows: ?
Blue arrows: ?
*Please be inform that all the lines I drew are just for educational purposes and they don't represent all the support and resistance levels on the charts. There also can have temporary support/resistance, intraday support/resistance, and other support/resistance levels that didn't show on the charts.